Go服务监控搭建入门
prometheus v2.33.4
grafana v8.4.1
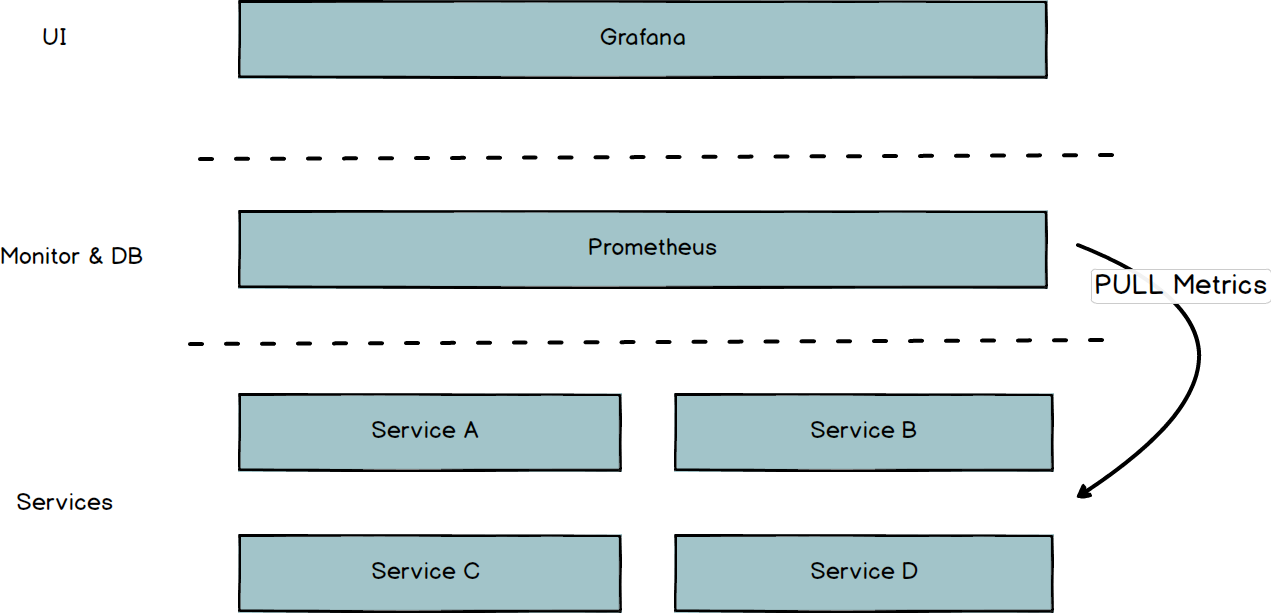
架构简介 整体的简易架构如下:
Grafana:作为UI,提供了丰富的监控面板。
Prometheus:Prometheus是一个监控&时序数据库。
需要被监控的服务:需要被监控的服务按照标准提供一个metrics接口,Prometheus会去通过暴露的这个接口拉取数据。Go已经有封装好的包github.com/prometheus/client_golang/prometheus,我们直接采用就可以了。
准备镜像 选取Prometheus镜像,如下:
1
2
3
4
# docker pull bitnami/prometheus:latest # docker run -d -p 9090:9090 bitnami/prometheus:2.33.4 docker pull bitnami/prometheus:2.33.4
选取Grafana镜像,如下:
1
2
3
# docker pull bitnami/grafana:latest # docker run -d -p 3000:3000 bitnami/grafana:8.4.1 docker pull bitnami/grafana:8.4.1
Go服务demo代码镜像:
首先我们选用现有封装好的代码包,如下:
1
2
3
4
# 选用现有的prometheus包 go get github.com/prometheus/client_golang/prometheus go get github.com/prometheus/client_golang/prometheus/promauto go get github.com/prometheus/client_golang/prometheus/promhttp
demo代码如下:
1
2
3
4
5
6
7
8
9
10
11
12
13
package mainimport ( "net/http" "github.com/prometheus/client_golang/prometheus/promhttp" ) func main () http.Handle("/metrics" , promhttp.Handler()) http.ListenAndServe(":2112" , nil ) }
启动Go服务,curl请求接口:
curl http://localhost:2112/metrics
获取到监控指标数据如下:
1
2
3
4
5
6
7
8
9
10
# HELP go_gc_duration_seconds A summary of the pause duration of garbage collection cycles. # TYPE go_gc_duration_seconds summary go_gc_duration_seconds{quantile="0"} 2.8697e-05 go_gc_duration_seconds{quantile="0.25"} 3.8094e-05 go_gc_duration_seconds{quantile="0.5"} 0.000125819 go_gc_duration_seconds{quantile="0.75"} 0.000190862 go_gc_duration_seconds{quantile="1"} 0.0098972 go_gc_duration_seconds_sum 0.025042382 go_gc_duration_seconds_count 45 ......略
通过prometheus的配置文件prometheus.yml注册我们Go样例服务,如下
1
2
3
4
5
6
7
8
9
10
11
12
scrape_configs: - job_name: 'prometheus' static_configs: - targets: ['prometheus:9090' ] - job_name: 'go-demo' static_configs: - targets: ['go-demo:2112' ] labels: server_name: server
编写Go服务的dockerfile,如下:
1
2
3
4
5
FROM amd64/golang:1.16 .3 -alpine3.12 RUN mkdir -p /home/go-demo CMD ["/home/deploy/go-demo/run.sh" ]
启动脚本/home/deploy/go-demo/run.sh,如下:
1
2
3
4
5
# !/bin/sh cd /home/deploy/go-demo \ && go run main.go \ && sleep 100000
服务编排(docker-compose) 上面我们是单独启动每个容器来实现的,接着我们用docker-compose来编排服务。
首先,创建network:
1
2
# 创建network docker network create example_default
接着,编写docker-compose.yaml文件如下:
1
2
3
4
5
6
7
8
9
10
11
12
13
14
15
16
17
18
19
20
21
22
23
24
25
26
27
28
29
30
31
32
33
34
35
version: "3" services: prometheus: image: bitnami/prometheus:2.33.4 container_name: prometheus volumes: - ./prometheus/prometheus.yml:/opt/bitnami/prometheus/conf/prometheus.yml ports: - "9090:9090" privileged: true networks: - default grafana: image: bitnami/grafana:8.4.1 container_name: grafana ports: - "3000:3000" privileged: true networks: - default go-demo: container_name: go-demo build: ./go-demo volumes: - ./go-demo:/home/deploy/go-demo ports: - "2112:2112" privileged: true networks: - default networks: default: external: name: example_default
最后,启动服务:
1
2
# 启动服务 docker-compose up -d
Grafana监控面板配置 首先prometheus其实自己是有监控面板的,我们可以通过下面的地址访问:
举个例子,比如通过如下的操作,我们就可以看见我们Go服务的Goroutines监控。
但是呢,Grafana提供了更丰富的监控面板,接着我们来搭建一个简单的Go服务监控。
访问grafana地址:
初始账号密码:
进入首页:
添加数据源:
选择数据源为Prometheus:
填写Prometheus服务的地址:
切换到Dashboards面板,选择导入一个面板:
接着我们就可以看见一个已经存在的面板了,这个面板是Prometheus自身监控的面板。
接着,我们来创建一个我们自己Go服务的面板,首先创建一个Go服务的目录(保证隔离和可读性,相当于namespace):
创建一个Go服务的面板:
创建一个指标视图:
选择视图类型为折线统计图,选择数据指标为go_gotoutines:
以此类推,我们就创建了一些列监控视图数据,比如goroutine数量、线程数量、heap内存数据、stack内存数据、mcache数据、mspan数据、GC数据等等,如下:
总结 如上我们就成功搭建了一个入门级别的「Go服务监控」,但是这还不能够上生产环境,为什么,留下两个课后思考:
除了系统、性能指标外,业务指标怎么统计?
上面注册服务是通过人工修改的,实际我们的服务都是动态服务发现了,所以配合服务发现我们怎么注册服务到prometheus呢?


